On this 2-Dimensional map:
The curved line means the rpm of the compressor wheel.
The Elliptical circle means the compressor's efficiency area. It's marked by the percent sign.
The horizontal axis is the amount of air before turbo,
(1 m3/s = 2118.88 cfm, 10 lb/min = 144.718 cfm).
The vertical axis is the pressure ratio.
Pressure Ratio=The pressure at compressor exducer vs the pressure at compressor inducer.
In another word, the ratio of the pressure of the air after compression vs the pressure before compression. As you can
see, the pressure ratio depends on the ambient pressure. For example, at sea level, a turbo boosts 14.7psi. Ambien pressure
is 14.7psi. That's 2 pressure ratio (PR) on the compressor map. Take that turbo to a higher elevation, the ambient pressure
is less than 14.7psi. If the turbo still boosts 14.7psi, the pressure ratio would be higher. Now on the compressor map, you
will see by moving up along a vertical line (to pump out the same cfm) and turbo efficiency has decreased as the elevation
increases (PR increases). Simply put, turbos lose performance and become less efficient as elevation gets higher.
The area to the right of the outer most elliptical circle is the least efficient area, choke area.
It means when the compressor reaches certain rpm, the air moved by the compressor wheel in the diffuser area of the compressor
housing is moving at or past the speed of sound. When the air speed reach sounic speed, the amount of air flow increase is
very small as compressor wheel rpm increases. In plain words, the compressor has reached its limit. You can try to pump more
psi, have to wheel spin faster, but very little more air is pumped out the turbo compressor. You can see now, the compressor
housing will need to properly match the compressor wheel. If you simply stuff a big wheel inside a small compressor housing,
the diffuse area will be very small. This causes the air inside the housing to move at higher speed. That's why some of the
so-called T28s which use a bigger compressor wheel inside the stock compressor housing does not produce good
hp.
Compressor Max Flow
The max flow of a compressor is shown on the compressor map. On the map, look for the interception of maximum compressor
wheel speed (rpm) and the least compressor efficiency curve. Find that interception. The horizontal coordinate is the max
flow.
The area to the left of Max Flow is 'choke area'.
The vertical coordinate is the pressure ratio at which the compressor reaches that max flow. From this boost level, as
the boost increases, very little air flow is increased. For example, if a compressor reach max flow at 2 PR or 1
atm pressure or 14.7psi, higher boost does not pump more air into the motor. But higher boost may be needed to increase
the manifold pressure for the motor to flow more air. A 5 liter motor with this turbo needs 15psi of manifold pressure
to flow a certain CFM. A 3 liter motor with the same turbo will need much higher manifold pressure to flow the same amount
of air although that turbo's compressor does not flow more air past 14.7psi.
Compressor Max Pressure
On the map, find the top-most point on the graph. The vertical coordinate is the max pressure ratio. For example,
2.8 pressure ratio at sea level is 1.8 times the atmospheric pressure, 1.8x14.7psi=26.46 psi.
Compressor max pressure is limited by compressor wheel speed. It's physically impossible to boost higher than this max
pressure for one particular turbo. Plus the pressure drop in the intercooler system, the actual max boost reading from a boost
gauge that's plugged into the intake manifolds maybe a few psi lower than this max pressure.
Finally, what a compressor map reads:
Most manufactures rate their turbos at 15psi. That's 2 pressure ratio. On the map, draws horizontal line from 2PR. When
the line intercepts the right-most elliptical circle, the corresponding number on the x-axis is the max cfm the turbo can
flow at 15psi.
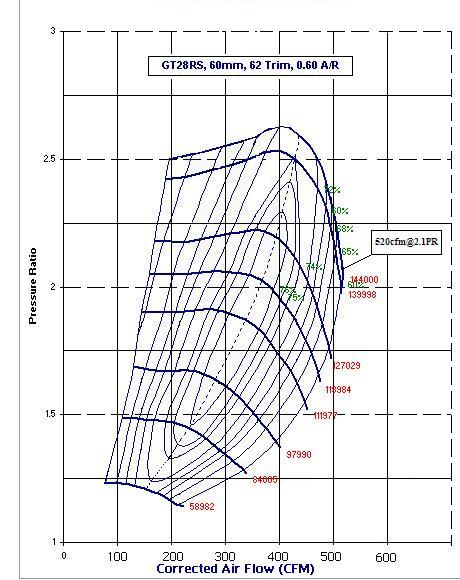
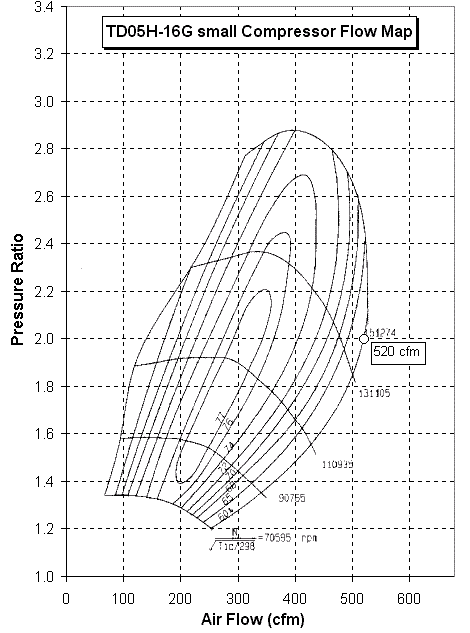
Use the TD05-16G's map for example, where the 2 PR line hits the right-most efficiency curve, it reads 520cfm as its
flow rate at 15psi.
To be completed...
Compare Compressor Maps
Well, compressor maps are really 3-Dimensional maps. Any compressor map looks a hill/peak in 3 dimensions. Our compressor
maps look like if you look at the hill directly from above vertically.The eclliptical lines of elevations are the efficiency
curves. Since in theory, we can always boost more and decrease turbo efficiency to get more cfm, lets set the same Pressure
Ratio and compare turbos at the same efficiency curves.
Now for fun, lets compare all the compressor maps available for the turbo applications for 300zx, GT2530,
GT2540, TD05-16G, PE1820, TD06-20G and To4E 56trim. Thanks to Chip for supplying the PE1820's compressor map. Since we are not pluging the engine flow, we can not compare the
spool up.
Lets set PR at 2 (14.7psi at sea level) and compare compressor flow using 68% efficiency as a reference and
max flow.
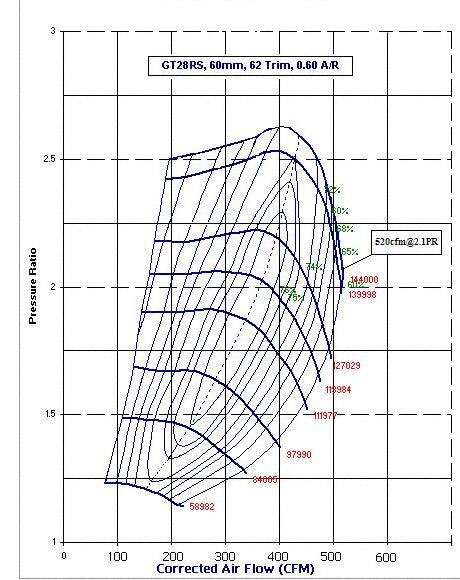
JWT BB-700: aka disco potato by JWT is a 62 trim, .86 a/r Garrett GT28RS turbo (from the
updated compressor map).
31LB/Min or 448cfm @ 2PR @ 72% efficiency.
37LB/Min or 520cfm max flow @16psi (from the updated map).
24psi max boost limited by compressor wheel speed.
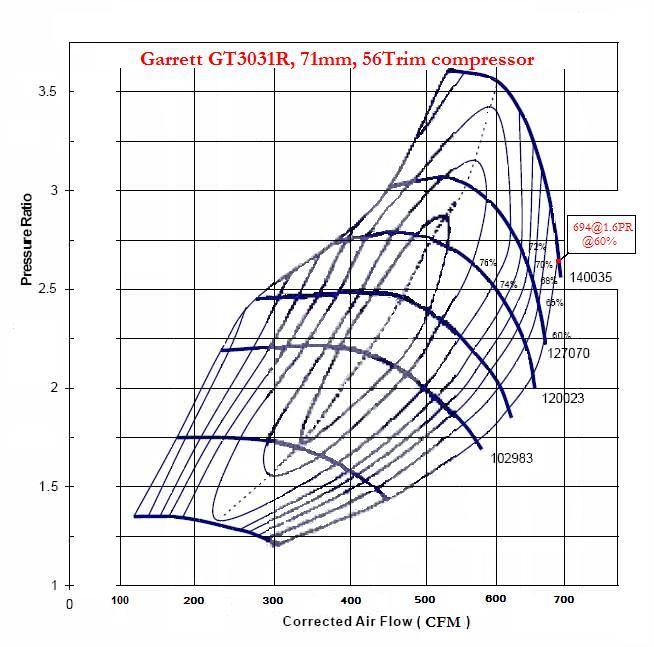
Garrett GT3071R: The new SZ 900 turbos are off-the-shelf
Garrett GT3071R turbos, uses compressor of GT37 compressor 56 trim, 71mm compressor exducer, 2.75 compressor housing
inlet, 2" outlet, T25 flange, 2" turbine outlet with integrated actuator. This turbo has basically the same specs as the HKS
GT2835.
48Lb/min or 694cfm max@60% efficiency.
3.5PR max pressure output.
Compressor Map:
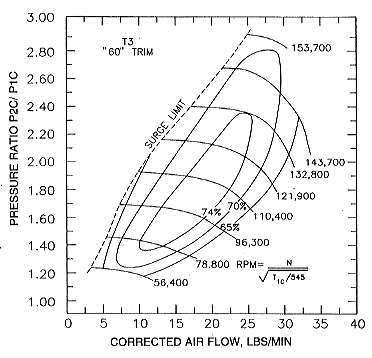
HKS GT2530: uses compressor of T3 63 trim, flows
a little more but slightly less efficient than the T3 60 trim.
30LB/Min or 434cfm @ 2PR @ 65% efficiency.
32LB/Min or 463cfm max flow @ 16psi.
28psi max boost limited by compressor wheel speed.
Compressor Map:
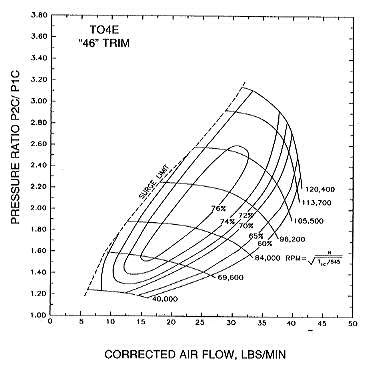
HKS GT2540: The POS 2540 uses To4E 46 trim compressor.
60mm housing inlet.
36LB/Min or 520cfm @ 2PR @ 68%.
39LB/Min or 564cfm @ 2PR @ 60%.
42LB/Min or 602cfm max flow @ 60% @ 19psi.
30.8psi max boost limited by compressor wheel speed.
Compressor Map:
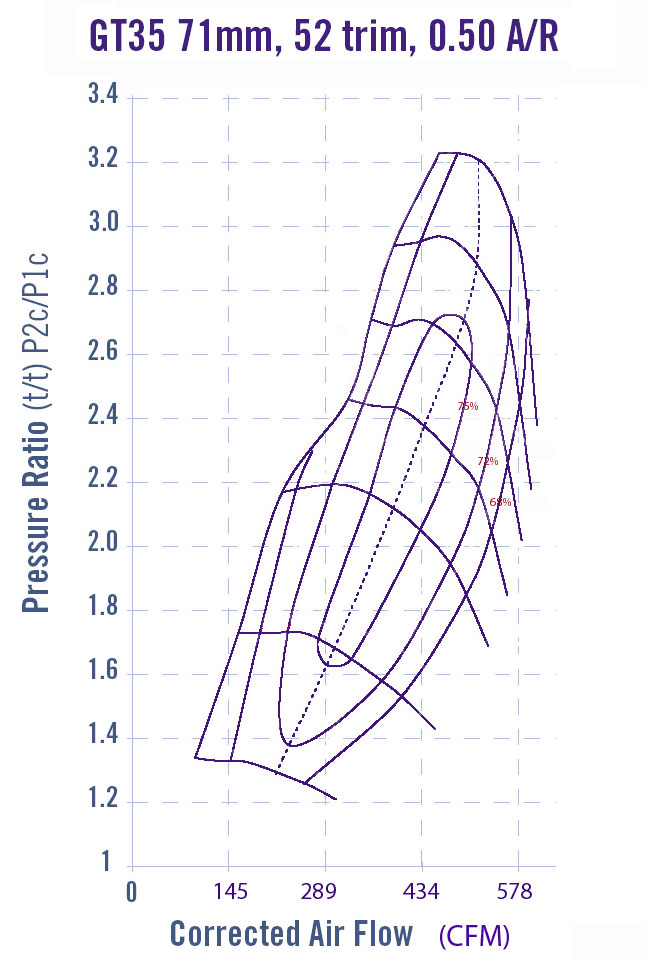
HKS GT2835: uses GT35 71mm 52 trim compressor.
42 LB/Min or 608cfm @ 2.7PR or 24.6psi @ 60%.
32psi max boost limited by compressor wheel speed.
Compressor map:
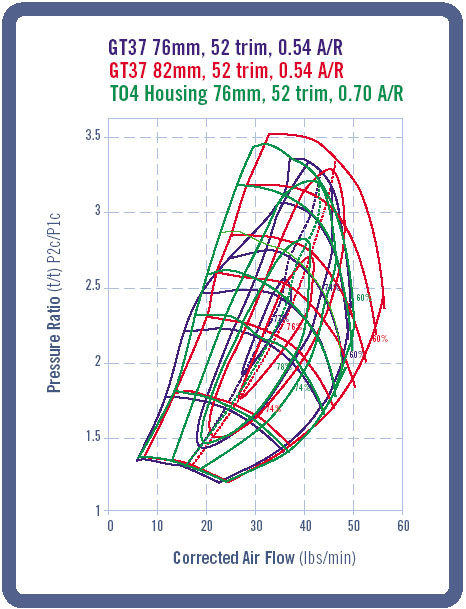
HKS GT3037: uses GT37 76mm 52trim compressor. 70mm
housing inlet.
49 LB/Min or 709cfm max flow @ 2.4PR @ 60%.
33psi max boost limited by compressor wheel speed
Compressor Map:
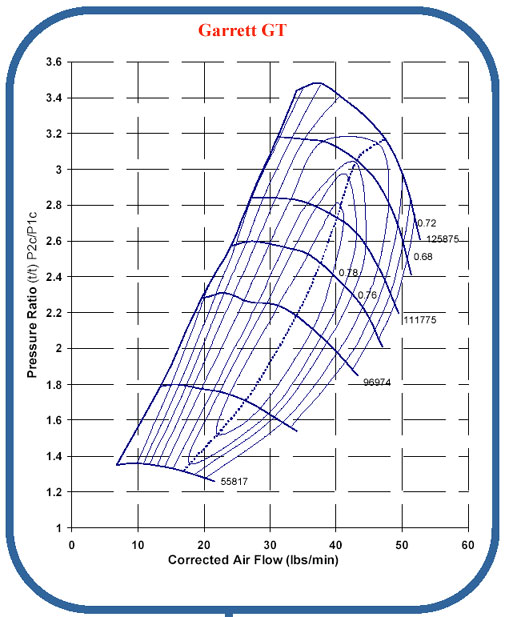
Garrett GT30R: uses GT37 76mm 56trim compressor. 4
inch compressor inlet, 2.5 inch outlet, 60mm 84trim turbine, T3 inlet flange, 4 inch outlet, .82 and 1.06 A/R.
52 LB/Min or 752cfm max flow @ 2.7PR @ 68% efficiency.
36psi max boost limited by compressor wheel speed.
Compressor Map:
TD05H-16G: uses 16G 60 trim compressor wheel.
475cfm @ 2PR @ 68%.
520cfm @ 2PR @ 60%.
525cfm max flow 2.3 @ 19psi.
27.6psi max boost limited by compressor wheel speed.
Compressor Map:
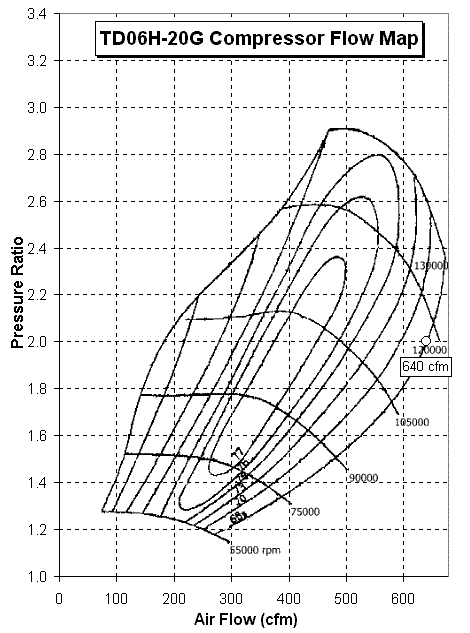
TD06S-20G: uses 20G 60 trim.
TD06H has a different style of turbine housing and turbine wheel than TD06S.
640cfm @ 2PR @ 68%.
685cfm max flow @ 68% 2.35PR or 20.7psi.
28psi max boost limited by compressor wheel speed.
Compressor Map:
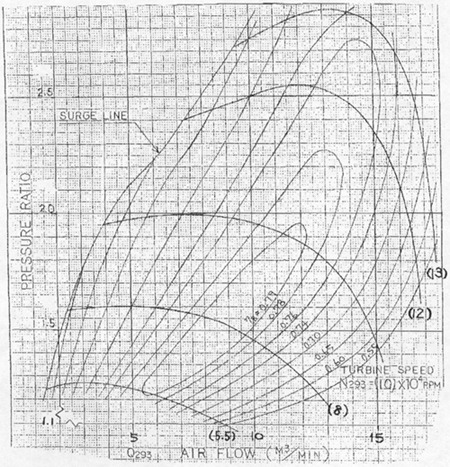
PE1820:
16M^3/min, (16/60)*10*211.888=565cfm @ 2PR @ 68%.
18M^3/min or 635cfm @ 2PR @ 55%.
18M^3/min or 635cfm max flow @ 2PR.
27psi max boost limited by compressor wheel speed.
Compressor Map:
Now lets some single turbo apps...
T66
60LB/Min, 868cfm @ 2PR @ 68%.
67LB/Min, 970cfm @ 2PR @ 60%.
72LB/Min, 1040cfm max flow @ 26.5psi @ 60%.
38psi max boost limited by compressor wheel speed
| T66 compressor map |
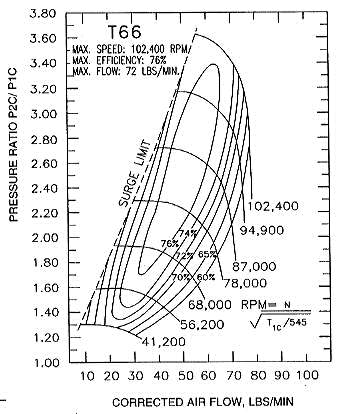
|
| 66mm compressor inducer |
T70
71LB/Min, 1028 cfm @ 2PR @ 65%.
84LB/Min, 1216 cfm max flow @ 29psi.
49psi max boost limited by compressor wheel speed.
| T70 Compressor map |
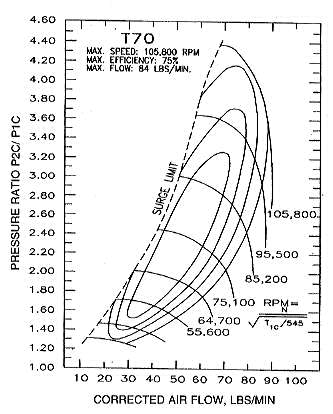
|
| 70mm compressor inducer (minor) |
T72
75LB/Min, 1085 cfm @ 2PR
88LB/Min, 1274 cfm.
50psi max boost limited by compressor wheel rpm.
| T72 map |
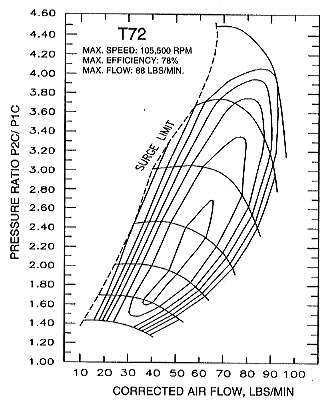
|
| 72mm compressor wheel |
T76
78LB/Min, 1128 cfm @ 2PR @ 65%.
93LB/Min, 1345 cfm @ 65%.
38psi max boost determined by compressor rpm
| T76 map |
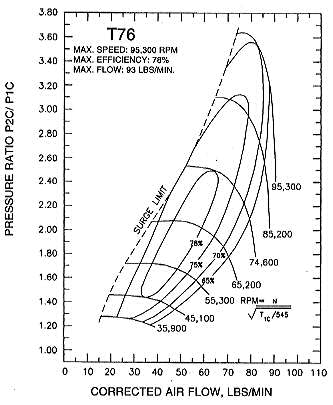
|
| 76mm compressor |
|